Author: Roger Ulrich, Tham Tran & John Boyden
Aug 1, 2021

During the period 1996 to 2012 the Mt. Wilson (MWO) program of magnetogram-Dopplergram observations utilized a 24-channel instrument that provided data for 10 spectral line samples. This system and its output is described in Ulrich et al. (1991) and Ulrich et al. (2002). Four spectral lines, lambdas 5237, 5250, 5896 and 6768 Angstroms are sampled with 12 pairs of blue-red band passes. Ten samples were obtained for each of 5896 and 6768. For 6768 the ten samples were needed to simulate the MDI instrument but two of the pairs could not be used in the standard reduction with the methods applied to the MWO data. The innermost pair for 5896 was changed in 2007 so altogether there are 10 sets of Dopplergrams. We designate these with names LLLL_sss.txt where LLLL is the truncated central wavelength in Angstroms of the sample and sss is half the port separation in milliangstroms.
The combinations we have are:
- 5237_052,
- 5250_078,
- 5895_064/5895_104,
- 5895_186,
- 5895_228,
- 5895_396,
- 6767_058,
- 6767_142, and
- 6767_230.
The raw data files were read with the standard reduction package developed and used as described by Howard et al. (1980), Howard et al. (1983) and Ulrich et al. (1991).
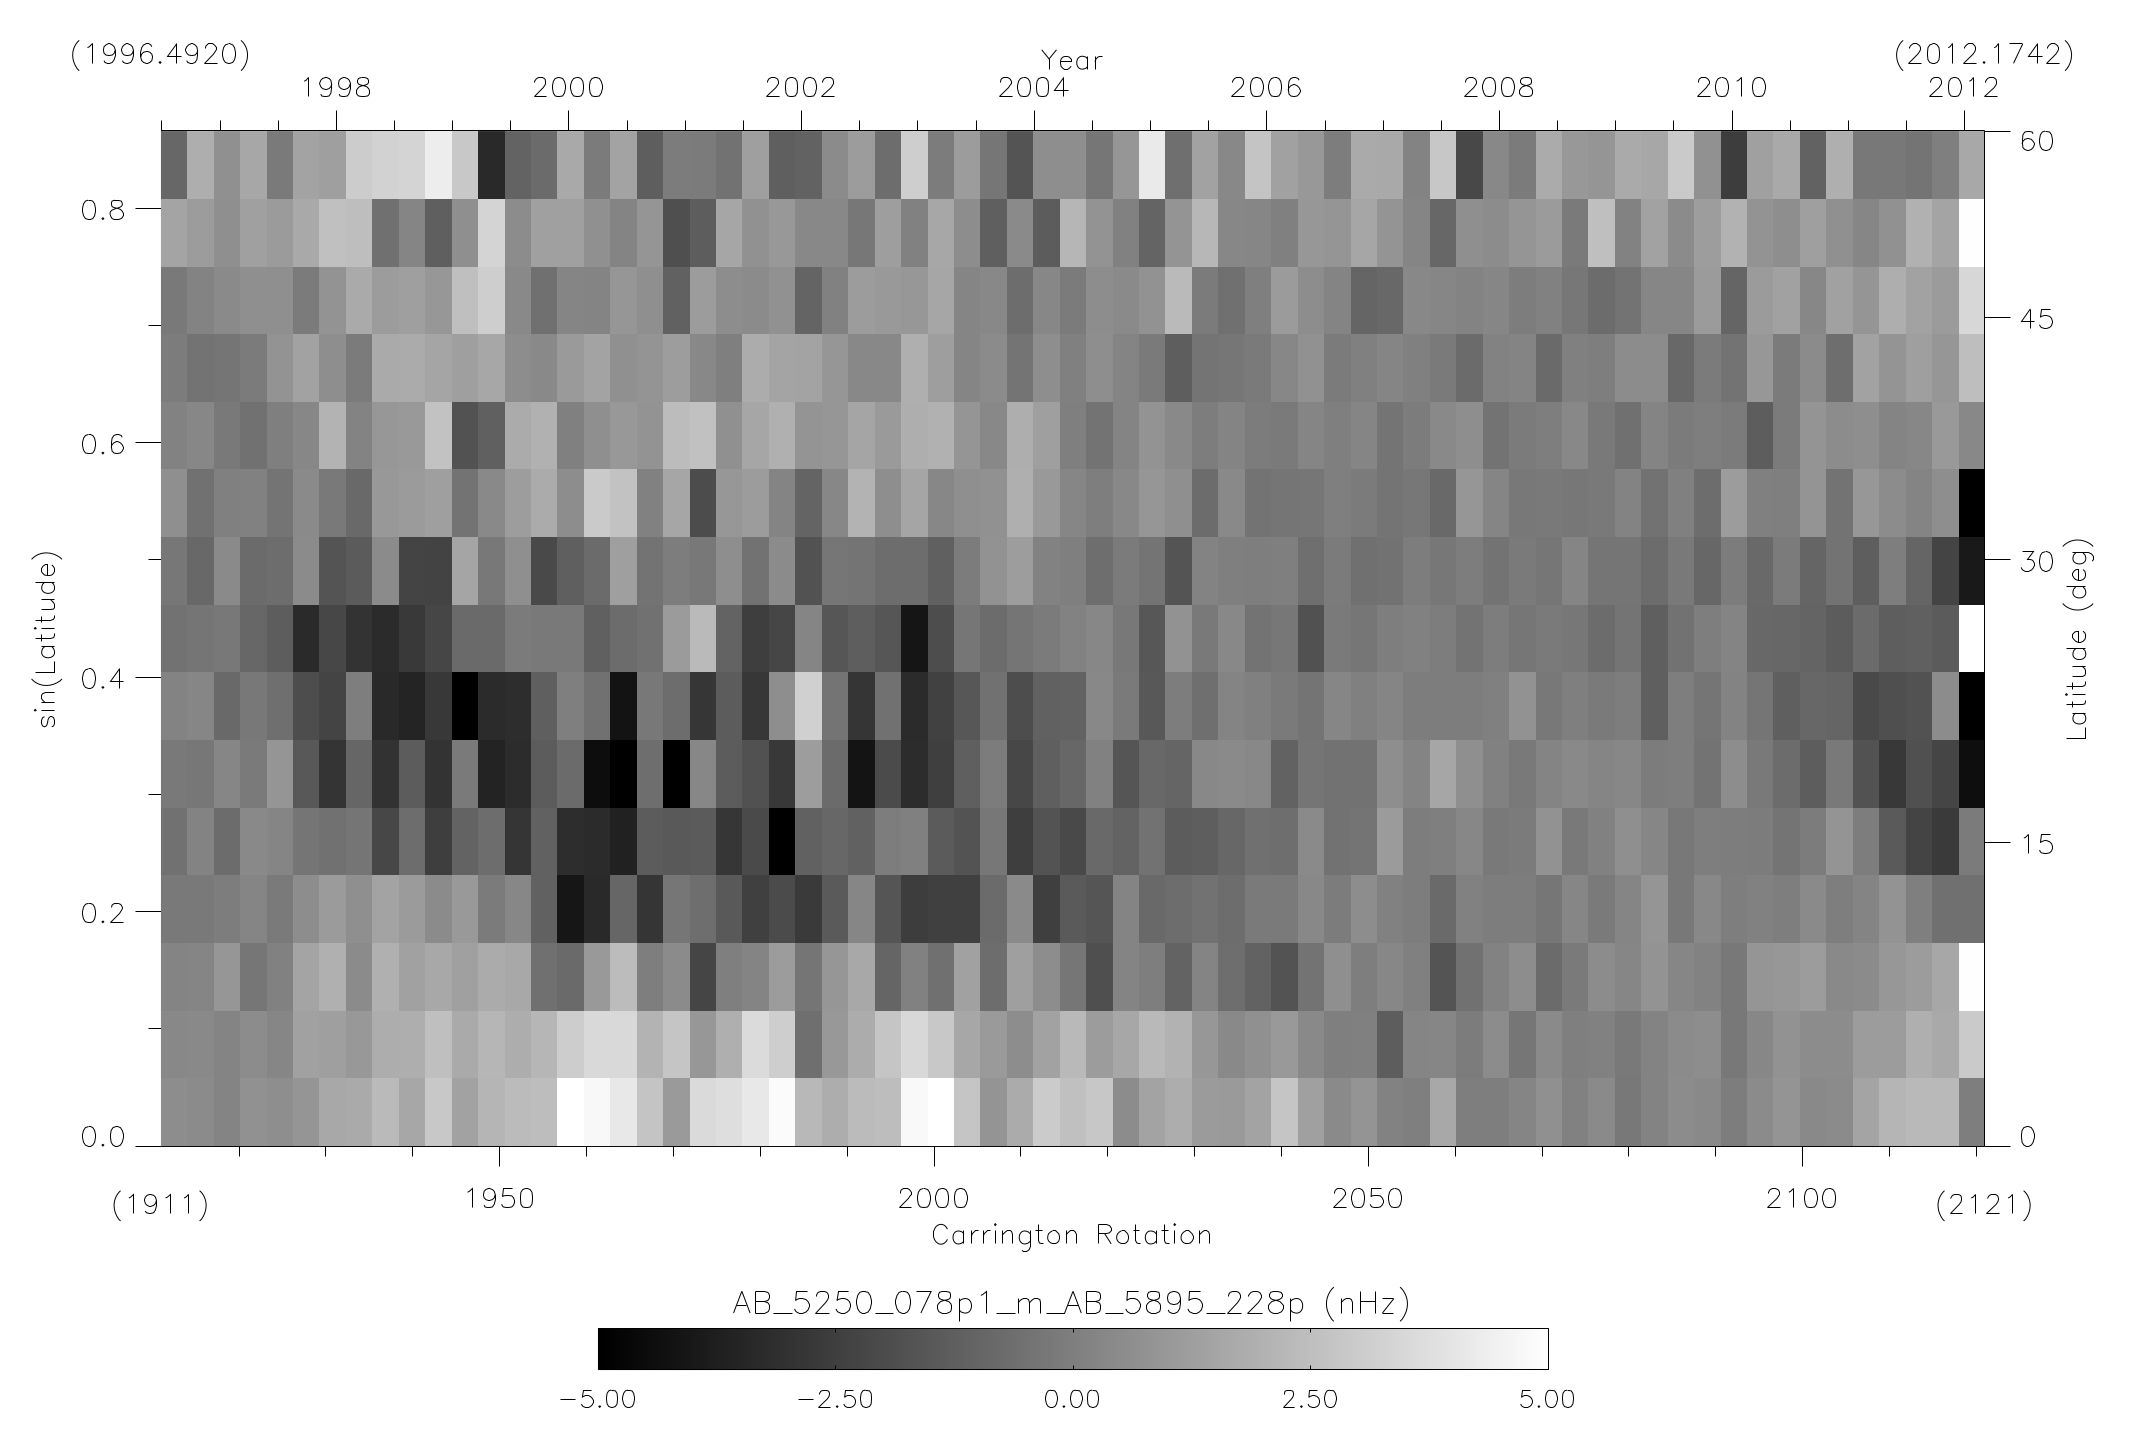
The data provided here has had differential rotation removed using the formula omega = A + B sin2(lat) + C sin4(lat) Deviations from this fit are provided in units of nano-Hertz.
The data is provided initially for each observation and at regular intervals of sin(lat). The data are binned into time intervals of 3 Carrington rotations. Wild points outside a range of about 3 standard deviations were not included in the binned averages. Figure 1 is an example of one combination.
For now, contact Roger Ulrich for access to these data. We are working with the CET to provide more permanent and public accessibility in line with the COFFIES Data Management initiatives.